Interesting enough, there is no proper guide out there that explains how to set up PHP debugging in Eclipse when you are working with a remote server. There are tons of guides, but they all assume that you're running PHP on your local machine. (Update: Actually, one of the first pages that come up on Google regarding PDT remote debugging is this manual page. However, this assumes you're running Zend and not XDebug. But, one of the sub-pages contains just the part I was missing regarding the server path map. This is because the help pages use frames. So in case you're looking for the standard instructions (which are less detailed than mine), head to https://www.eclipse.org/pdt/, click Manual in the navigation menu, then select Tasks => Using the Debugger => Setting up Remote Debugging.)
So here are my steps to set it all up. I'm assuming you have a working server configuration. I'm using Apache, PHP and xdebug on Debian, all installed through Debian's package manager.
Set up Xdebug
The way that Xdebug works is, you tell it the IP of your machine (i.e. the machine on which you want to debug). Then you click the Debug button in Eclipse. From that point on, Xdebug (on the server) will try to initiate a debugger session every time a script loads. So it's the server that initiates the debugger session, not your machine. Your machine is just listening. Details can be found here.
Locate your xdebug config file. In Debian, it's /etc/php/8.2/apache2/conf.d/20-xdebug.ini - but you could also just put it in your php.ini.
A typical set up may look like this:
zend_extension=xdebug.so
xdebug.client_host=192.168.178.129 <= IP address of the machine where Eclipse runs *
xdebug.mode=debug
xdebug.client_port=9000 <= Port your machine is listening on **
;xdebug.idekey="ECLIPSE_DBGP" <=  this is not needed unless you want an extra layer of security ***
xdebug.log=/var/log/xdebug/xdebug.log <=> this is not needed, unless you want to trace what XDebug is doing ****
*/** If you're behind a router and your server is on the Internet, put your public IP address here. Then configure your router to forward all packages on the selected port (** above) to your local machine on the same port (you could use a different port to forward to, but if you think about doing that, you probably know yourself what to do).
*** There's an additional layer of security you can use here, and Eclipse will by default pass the XDEBUG_SESSION_START URL parameter, which is always ECLIPSE_DBGP (haven't found out where to change this). This is usually not needed, as your IP address should be unique enough, so I'm not going to cover it here. Our setup will work without these parameters.
**** Make sure you put the log file in a directory that is owned by your web-server (or the user PHP runs with). Also, comment this line unless you're investigating an issue. Otherwise, it will create a lot of log entries.
Reload your webserver if PHP is running as a module.
Set up Project
- Download & Install Eclipse PDT (PHP Development Tools) - https://www.eclipse.org/pdt/
- In the Project Explorer, select New => Synchronized PHP Project
- Choose a remote connectio and a remote path
- Once you click finish, Eclipse will sync the remote directory to your local computer (you need the remote files on your machine to debug - otherwise (if you don't want to debug) you could also use the Eclipse Plugin "Remote Systems Explorer" to work directly on your target machine.
Note: The sync appears to use git. I hadn't set up my remote directory as a git repository, but the download still worked. However, the upload didn't. I had to do "git init" inside the remote directory on the remote server for the upload to work
Configure PHP in Eclipse
Not really needed for Debugging, but for Eclipse PDT to be able to provide PHP validation, you need to have the PHP executable on your system. Download it from php.net and save it in the location of your choice. Then proceed to configure Eclipse:
- Under PHP =>Installed PHPs, add your PHP Executable
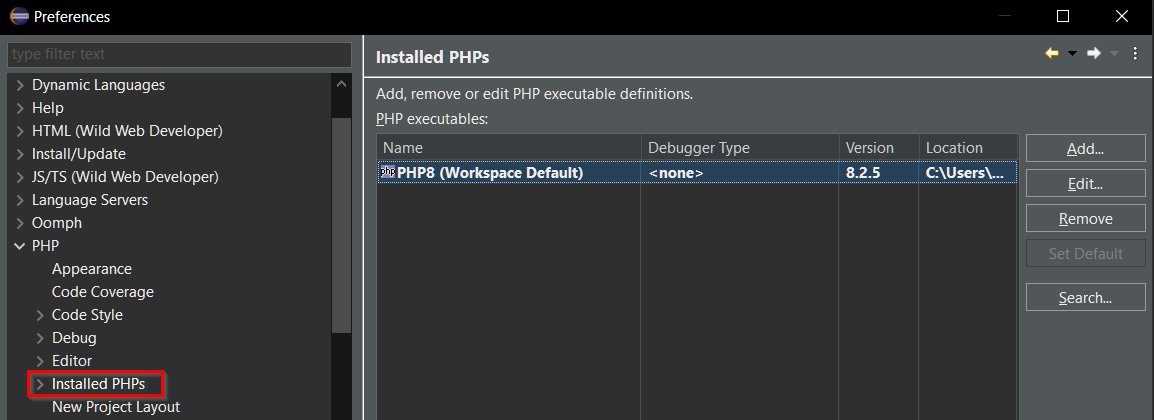
- The setup is straight-forward - choose a name and the path where your php.exe resides:
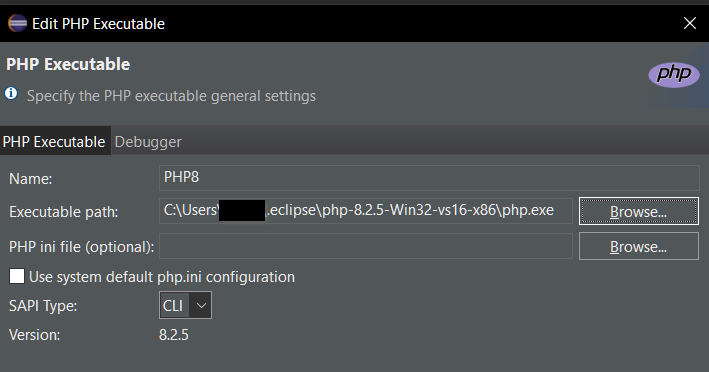
- You don't need to configure the Debugger tab - this refers to your local machine only and has nothing to do with debugging on your serverG.
Configure Global Debugger Settings in Eclipse
Now proceed to configure the Debugger in Eclipse.
- Stay in Preferences from the previous step.
- Navigate to PHP => Debug => Debuggers => Xdebug => Configure

- There are only two relevant settings here (If you're behind a proxy, it's more complicated but this is out of my scope.)
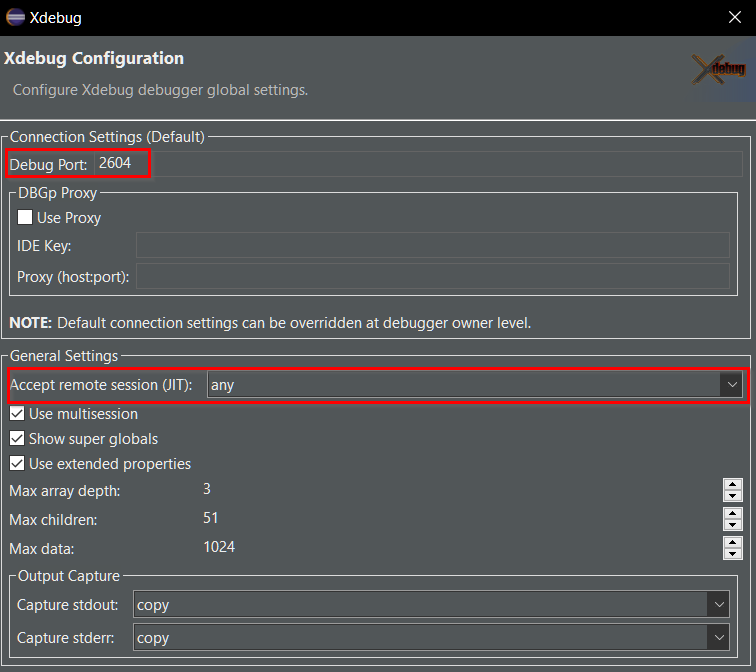
- Under Debug Port, configure the port that you've put in your php.ini on the remote server - or the port your router is forwarding to.
- Under Accept remote session, select any so that your Eclipse listens on remote connections (not just those from localhost).
- Click OK
- Stay in Preferences and go to PHP => Servers => New
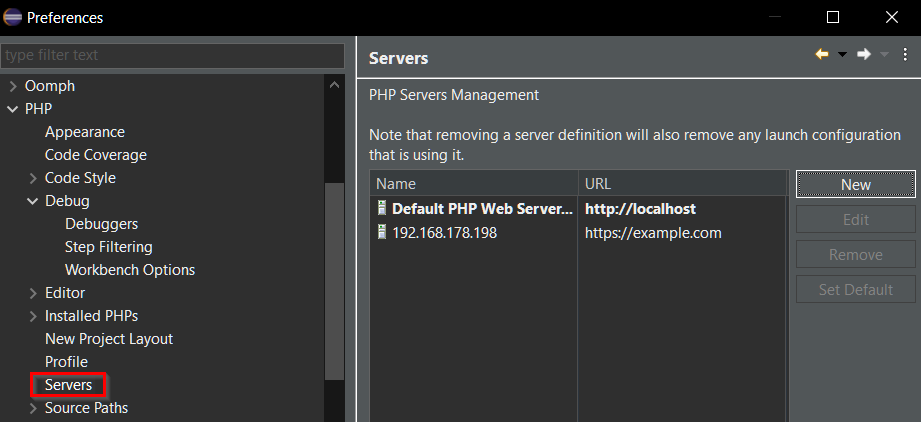
- Note: It's best to set up a separate server for each website/project.
- The Server Name can be anything. The Base URL is the URL where your website is reached on the Internet. The Document root is the corresponding root folder in your Eclipse workspace.
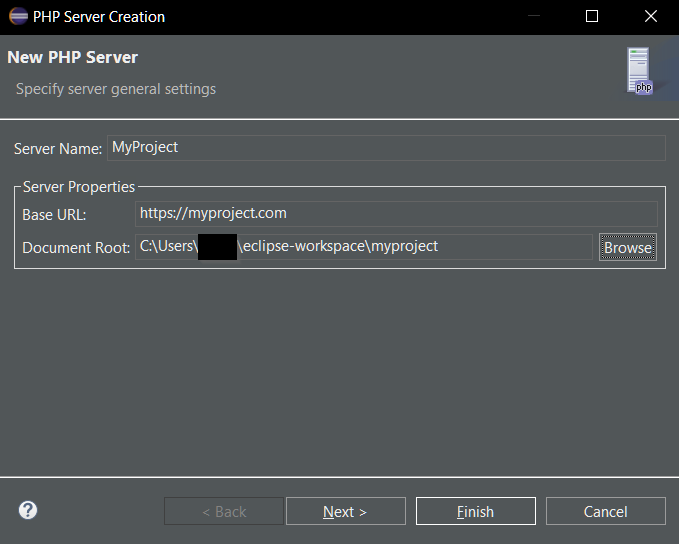
- Choose next and select the Xdebugger you just configured above. You have the option to change the debugger port, but this is not necessary.
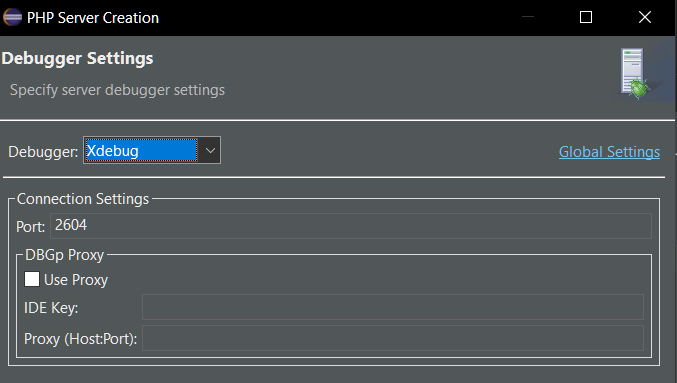
- This step is the most important one and the main difference between debugging locally (as most guides describe) and debugging remotely. You need to create a path mapping.
- Choose New
- Under Path on Server, maintain the DocumentRoot of your website on the webserver. Under path in File System, select the corresponding folder in the Eclipse Workspace (you can also use Path in Workspace).
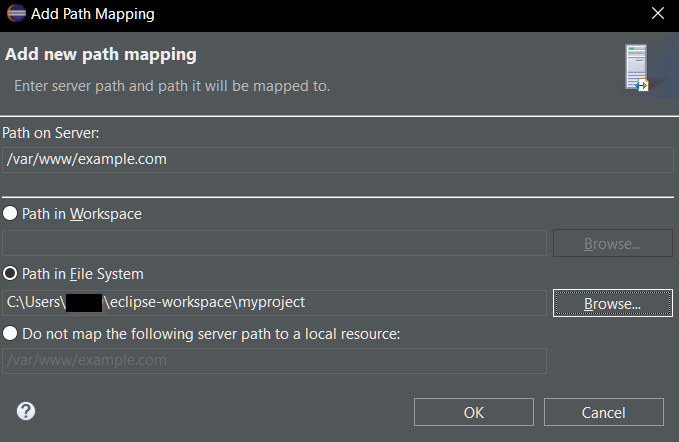
- This is all in Settings. Click OK and close Preferences.
This path mapping is important to make the remote server debugging work. Without it, if you start the debugger, your Eclipse will tell your remote server to set a breakpoint in "C:\<path_to_eclipse>\myproject\index.php". Of course your remote server doesn't have that filepath. On your remote server, the files are in /var/www/example.com/index.php. So by "mapping /var/www/example.com" to "C:\<path_to_eclipse>\myproject", Eclipse will tell the server to set the breakpoint in /var/www/example.com/index.php. Without this, your Eclipse will never stop on the breakpoints you set.
Configure Project-specific Debugger Settings
As mentioned above, each project will usually have its own domain and therefore Server settings.
- Right-click your Project in Project Explorer and choose Properties
- Go to PHP => Debug and check "Enable project specific settings". There are a number of things to point out here:
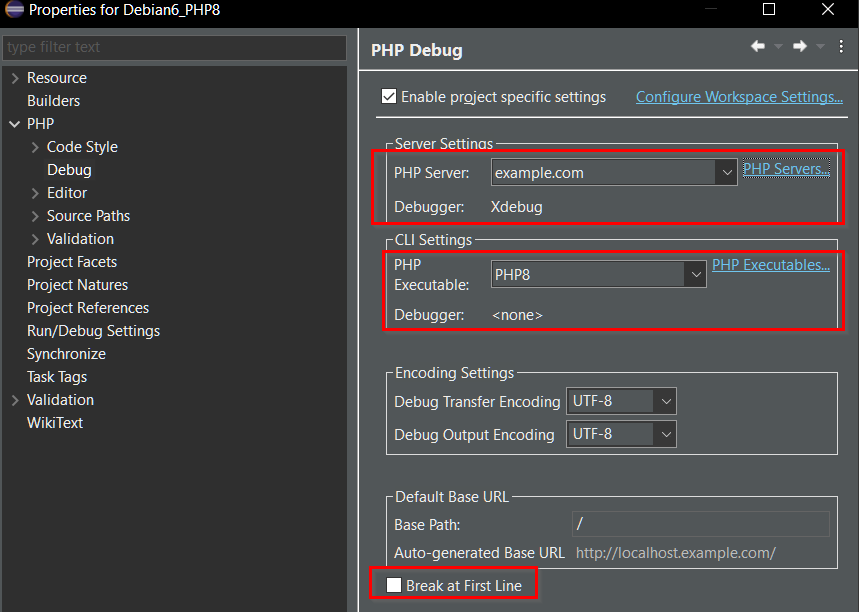
- Under Server Settings, choose the server you just created for this project. It will populate the Debugger automatically.
- Under CLI Settings, choose the php.exe file you maintained above.
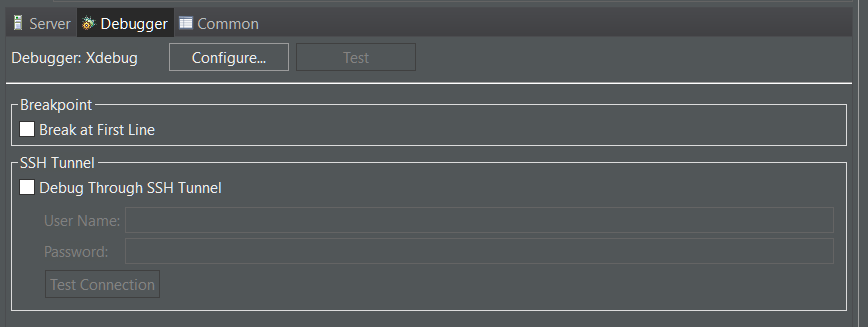
- It's a good idea to disable "Break a First Line". Otherwise PHP will stop at the very first statement it executes every time you launch the debugger. This is usually not what you want as you would have set your breakpoints and would expect the debugger to stop only there.
Configure Debug profile
Last, you need to create a Debug configuration. This is a way of linking your server configuration to the debugger and telling Eclipse what to do when you hit the debug button.
- Select Run from the menu => Debug Configurations
- Right-click PHP Web Application => New Configuration
- There are a number of options here:

- Name: any name to help you identify the configuration
- PHP Server: Select the PHP Server belonging to this project (same as above)
- File: Choose the file that should be called when launching the debugger (Eclipse PHP will always open the browser with this file, I haven't yet found a way to disable this).
- URL: URL matching the file selected in the previous step. You usually have to disable auto-generate. As in my example, we don't need to supplly index.php as a path.
- Under Debugger, all should be good. Again, you have the option to enable/disable break at first line. I'm not sure what "Debug through SSH tunnel does".
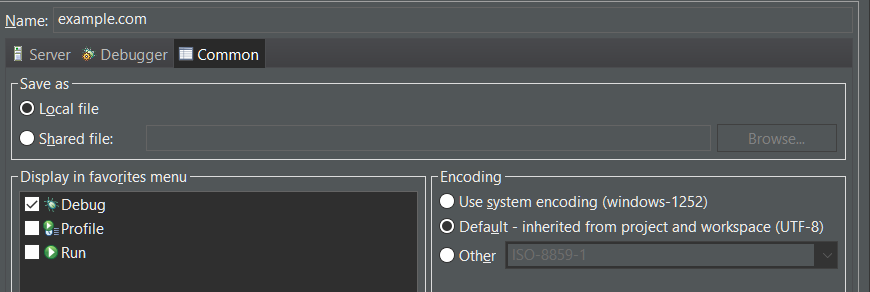
- Under Common, you can make a few settings, but the only thing that's really important is to flag "Debug" - otherwise this profile won't be considered a Debug profile.
Launching the Debugger
You're done! You should now be able to launch the debugger. Don't forget to set a breakpoint (as you've disabled break on first line).
Hit the Debug button:

Your default browser should open and if you've set your breakpoint somewhere inside the first page it loads, your Eclipse will flash and the browser will stop executing:

The navigation is easy, with F5 (Step in), F6 (Step over), F7 (Step out) and F8 (Continue) - just like in ABAP :-).